Why Data Analytics for Sales and Marketing Matters
Data analytics for sales and marketing turns scattered customer, campaign, and revenue data into clear actions. Start by bringing CRM, website, e-commerce, advertising, and customer feedback data into one reliable view. Then track shared metrics such as lead conversion rate, customer acquisition cost (CAC), pipeline velocity, average deal size, and customer lifetime value (CLV) to find what is working, what is leaking revenue, and what to improve next.
For a growing business, this means fewer guesses. Marketing can see which channels produce qualified leads. Sales can focus on accounts most likely to buy. Leaders can forecast demand, protect margins, and make smarter decisions about pricing, inventory, and team targets.
The need is growing fast. Global data volumes have been estimated to increase by roughly 60% each year, but more data does not automatically create better decisions. A unified analytics engine matters because it connects the full customer journey and turns raw numbers into useful context.
I am Mike Ibrahim, Founder and CEO of RewardLion and a marketing leader with more than a decade of experience building sales, e-commerce, and growth strategies. My work with data analytics for sales and marketing focuses on using practical insights to improve lead generation, customer relationships, and sustainable revenue growth.
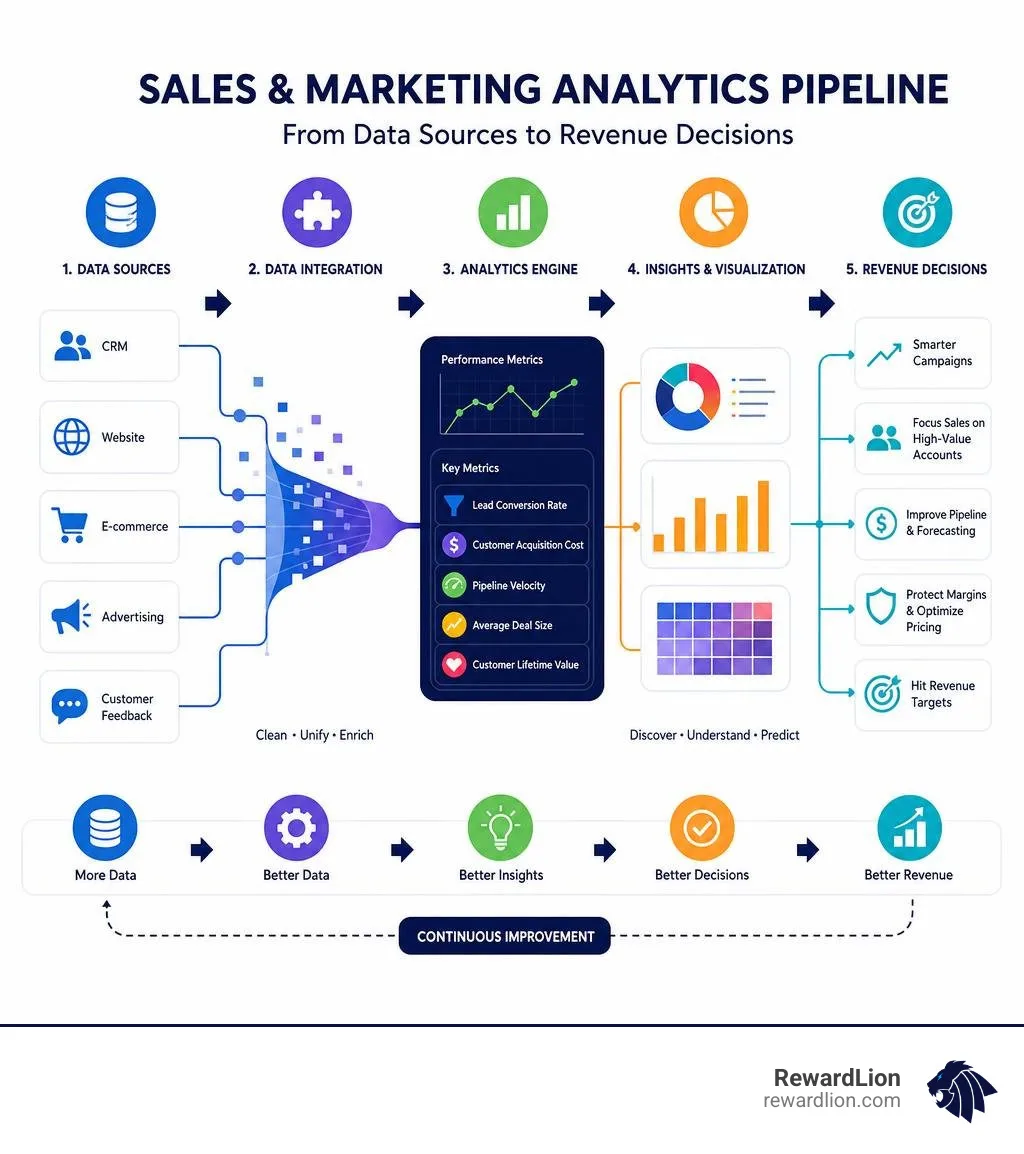
The Core Pillars of Data Analytics for Sales and Marketing
To run high-performing revenue operations, we must distinguish between two complementary tools: sales analytics and sales intelligence.
Sales analytics examines internal historical and real-time operational data: conversion rates, stage-by-stage velocity, pipeline values, and rep activity. It tells us how our internal engine runs. Sales intelligence provides external context: firmographics, buying triggers, technographics, and verified contact points. Analytics tells you how your team converts deals, while intelligence shows you who to contact next.
When both inputs feed a centralized engine, commercial teams eliminate blind spots. Rather than wrestling with disconnected spreadsheets across marketing automation and CRM instances, businesses deploy unified Sales and Marketing Analytics architectures. Scientific inquiry confirms that data-driven decision-making systematically lifts sales force productivity and organizational agility (Fergurson, 2020).
Analytics Tier | Core Question Answered | Primary Business Value | Key Commercial Output |
|---|---|---|---|
Descriptive | What happened? | Establishes historical baselines and transparency | Retrospective revenue and win/loss reporting |
Diagnostic | Why did it happen? | Uncovers root causes of friction or success | Attribution modeling and conversion leak analysis |
Predictive | What is likely to happen? | Improves resource planning and target setting | Revenue forecasts and churn probability scoring |
Prescriptive | What should we do next? | Directs automated, optimal revenue actions | Dynamic discount limits and automated deal routing |
The Four Tiers of Analytics: From Historical Data to Prescriptive Intelligence
Mastering commercial analytics requires progressing through four structured layers:
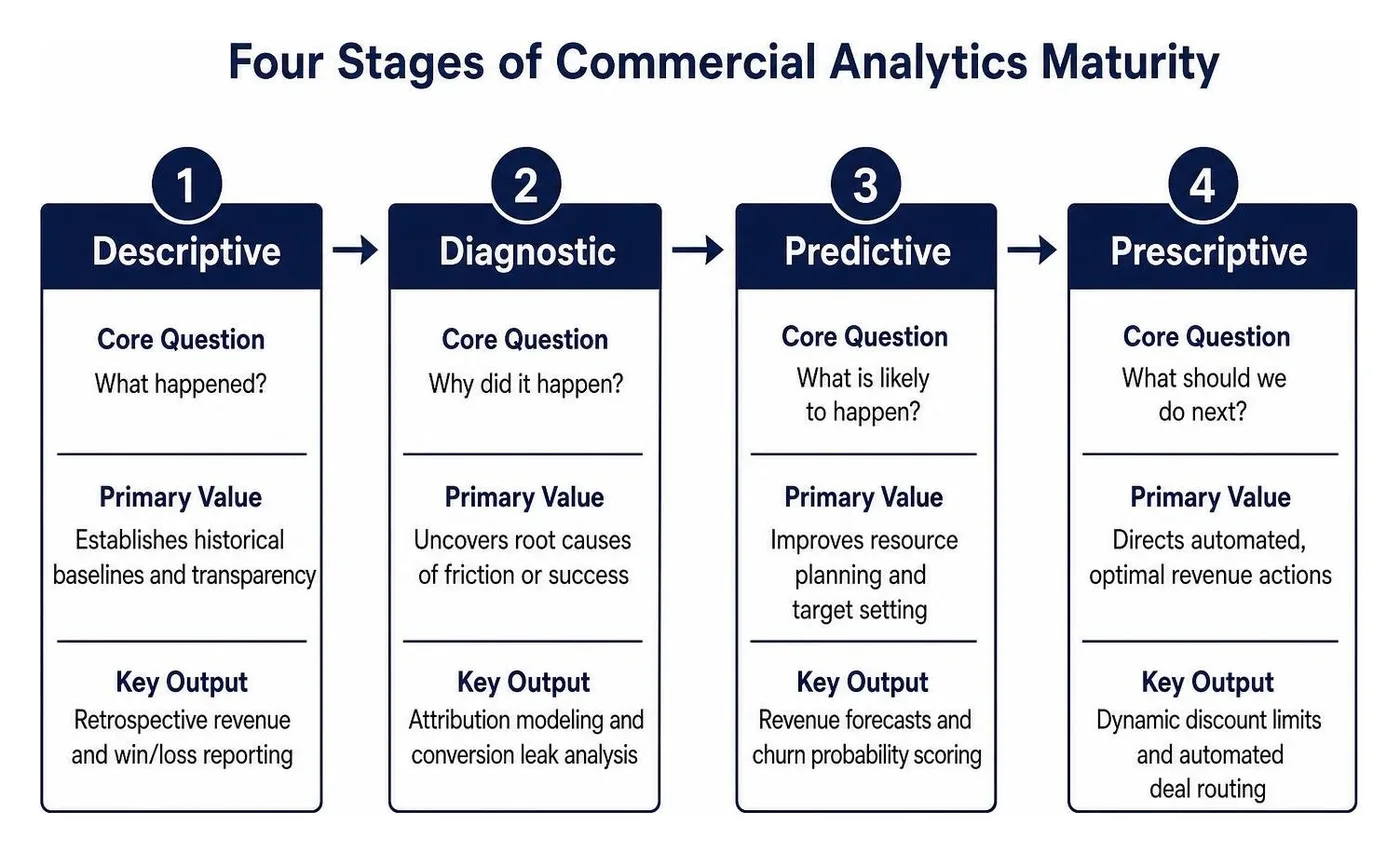
Descriptive Analytics: Measures past performance. We evaluate trailing quarterly metrics, regional gross revenue, closed-won totals, and marketing campaign volume.
Diagnostic Analytics: Isolates root causes. If inbound conversion dropped 14% last month, diagnostic tools cross-reference lead source quality, page response times, and sales outreach cadence to explain why.
Predictive Models: Projects upcoming outcomes. By evaluating historical pipeline velocity, seasonal purchase cycles, and lead scores, machine learning models estimate closing probabilities across pipeline stages.
Prescriptive Recommendations: Provides explicit, data-backed execution directives. It suggests exact promotional pricing boundaries, signals at-risk enterprise accounts, and routes leads to account executives based on historical win rates.
Bridging the Gap: Using Data Analytics for Sales and Marketing Alignment
Marketing and sales teams often run into friction when operating with mismatched metrics. Marketing celebrates generating 5,000 top-of-funnel leads, while sales notes that fewer than 2% met ideal buyer criteria.
Deploying Using Analytics to Align Sales and Marketing Teams resolves this divide by establishing a shared revenue framework:
Unified Lifecycle Definitions: Establishes strict data parameters for Marketing Qualified Leads (MQLs), Sales Accepted Leads (SALs), and Sales Qualified Opportunities (SQOs).
Closed-Loop Attribution: Connects marketing campaign IDs directly to bottom-line CRM opportunity revenue, proving exact channel returns.
Shared Pipeline Transparency: Gives marketing direct visibility into rep follow-up times and deal progression, while sales reps see earlier digital engagement histories.
Key Metrics and Data Collection Across the Customer Journey
Creating an operational analytics system requires structured data ingestion across digital, point-of-sale (POS), and conversational channels. Research by organizations like the Kaizen Institute emphasizes that structured continuous improvement in marketing and sales depends on real-time operational feedback loops.

A functional data collection framework integrates four core sources:
CRM Platforms: Deal stages, interaction notes, sales cycle duration, activity logs, rep commission records.
Digital Analytics & Tracking: Multi-touch website visits, content consumption, landing page conversion paths.
E-Commerce & POS Engines: Transaction frequency, basket sizes, SKU margins, refund rates.
Customer Voice & Surveys: Net Promoter Scores (NPS), qualitative win/loss notes, post-demo feedback.
Essential Marketing and Sales Metrics to Monitor
High-velocity teams track targeted KPIs that expose the operational health of their customer pipeline. Specialized Lead Generation Analytics allow teams to benchmark performance across every touchpoint:
Customer Acquisition Cost (CAC): Total sales and marketing investment divided by total acquired customers over a set period.
Customer Lifetime Value (CLV): The net profit generated across the full lifecycle of an active customer relationship.
Pipeline Velocity: Measures how rapidly revenue moves through pipeline stages, calculated as: $$\text{Pipeline Velocity} = \frac{\text{Active Opportunities} \times \text{Win Rate (\%)} \times \text{Average Deal Size}}{\text{Sales Cycle Length (Days)}}$$
Sell-Through Rate: The volume of inventory or service subscriptions sold relative to total stock received from suppliers.
Churn Rate: The percentage of subscribers or recurring customers who cancel over a defined period.
Overcoming Modern Data Collection and Hygiene Roadblocks
Data accuracy challenges threaten analytical precision. Without structured data governance, organizations build unorganized data lakes filled with duplicates, conflicting lead sources, and broken tracking tags.
Implementing an enterprise-grade Analytics Platform for Marketing resolves these challenges through automated ingestion routines:
Deduplication Pipelines: Cross-checking incoming email domains against active accounts to prevent fragmented communication logs.
Unified Data Dictionaries: Standardizing definitions so "Deal Creation Date" means the same thing across marketing, finance, and sales.
Multi-Touch Attribution Rules: Moving beyond basic first-touch or last-touch credit to capture multi-channel buyer touchpoints.
Transforming Raw Commercial Data into Actionable Strategy
Collecting clean data sets the stage for strategic revenue optimization. Global trend trackers such as Statista show that businesses employing structured commercial intelligence consistently secure stronger market shares and customer retention rates.
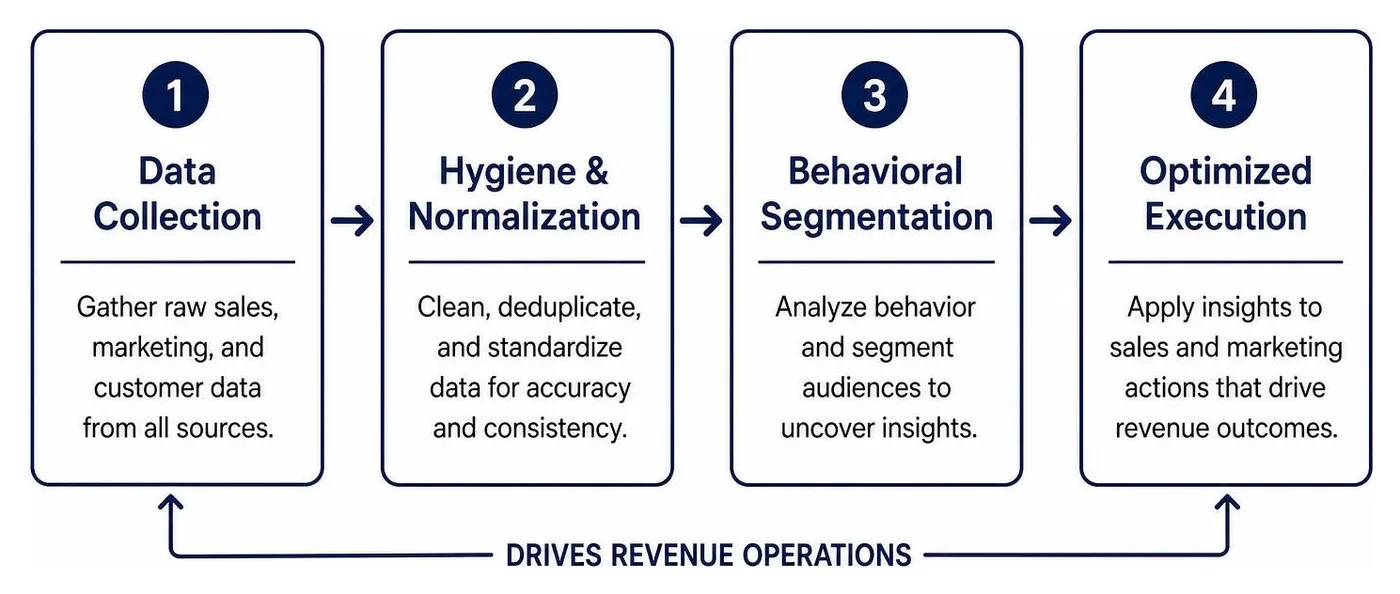
Implementing Data Analytics for Sales and Marketing Optimization
Commercial analytics creates immediate impact in product range management and dynamic pricing:
Long-Tail SKU Pruning: Commercial data highlights low-margin, high-overhead products that tie up working capital. Teams can systematically retire low-yield offerings and reallocate resources toward core drivers.
Core Product Expansion: Pinpoints feature requests, complementary service needs, and unmet buyer demands to guide product roadmaps.
Price Elasticity Modeling: Analyzes conversion sensitivity at varying price points across distinct customer segments. This lets leadership establish floor discounts, preventing sales teams from sacrificing margins unnecessarily.
AI-Driven Automation and Machine Learning in Prescriptive Forecasting
Modern commercial execution relies heavily on integrated machine learning. Academic sales foundations have dedicated over $125,000 to sales analytics research initiatives to explore how algorithmic systems turn raw inputs into dependable revenue forecasts.
Employing All-in-One Analytics systems powered by artificial intelligence delivers high-leverage advantages:
Predictive Pipeline Forecasting: Replaces subjective rep estimates with algorithmic models that weigh past conversion patterns, historical stage times, and digital intent signals.
Dynamic Lead Scoring: Prioritizes outreach queues by evaluating behavioral signals, ensuring reps reach out to hot leads immediately.
Automated Workflow Routing: Instantly routes accounts to specialized reps based on geography, industry expertise, or deal complexity.

Designing Executive Dashboards and Visualizing Commercial Intelligence
Data alone cannot inspire action unless translated into clean visual narratives. Executive dashboards bridge complex algorithmic pipelines and daily commercial execution.
To build actionable reporting interfaces, prioritize these dashboard design best practices:
Design for Specific Roles: Give frontline reps tactical queues (next-best actions, closing tasks), while executives see strategic indicators (CAC-to-CLV ratios, regional forecasts, quota attainment).
Establish Clear Visual Hierarchy: Place primary metrics at the top left, followed by diagnostic conversion funnels and granular performance tables below.
Incentivize Teams Transparently: Link real-time dashboard outputs directly to commission tracking to give sales reps immediate visibility into their earnings.
Frequently Asked Questions about Sales and Marketing Analytics
What is the main difference between sales analytics and sales intelligence?
Sales analytics analyzes internal operational metrics (win rates, pipeline velocity, stage durations) to improve internal processes. Sales intelligence gathers external prospect data (technographics, company sizing, verified contact details) to find new accounts.
How does predictive analytics improve sales forecasting accuracy?
Predictive analytics replaces subjective sales rep opinions with machine learning algorithms that evaluate historical close rates, seasonal variations, buyer engagement velocity, and macro-level factors to project revenue accurately.
How can analytics help identify unprofitable products or optimize pricing?
Analytics measures gross margin contributions and price elasticity per customer segment. This reveals low-margin long-tail products that drain operational focus and sets firm discount boundaries to protect profitability.
Conclusion
A unified commercial data engine breaks down operational silos and gives organizations clear visibility into their entire revenue engine. When marketing and sales align around reliable metrics, diagnostic problem-solving, and predictive automation, sustainable revenue growth follows.
Building and maintaining this modern analytics stack does not require juggling disjointed software or managing isolated teams. RewardLion installs a fully connected growth system powered by AI, executed by dedicated growth experts, and optimized continuously. Explore our AI-Powered Growth Operating System to unify your marketing, sales, and analytics under one scalable engine.
References
J Ricky Fergurson. "Data-driven decision making via sales analytics: introduction to the special issue." Journal of Marketing Analytics, 2020. PMCID PMC7382705.