Why Sales and Marketing Analytics Is the Engine Behind Sustainable Business Growth
Sales and marketing analytics is the practice of measuring and analyzing data from your sales and marketing activities to understand what's working, what isn't, and where to focus next.
Here's a quick breakdown of what it covers:
What It Is What It Does Why It Matters Collecting data from CRM, ads, web, and sales tools Tracks performance across the full customer journey Shows you exactly where revenue comes from Analyzing metrics like CAC, ROI, and conversion rates Identifies gaps and opportunities Helps you spend smarter, not more Aligning sales and marketing around shared data Breaks down team silos Drives faster, more confident decisions
The stakes are real. Today, 80% of marketers say their ability to track ROI for digital marketing investment could use improvement — and only 33% say they gain insights fast enough to act on them. For small and mid-sized businesses especially, that gap between data and decisions is where growth stalls.
The good news? You don't need a massive team or enterprise budget to benefit. You just need the right approach.
I'm Mike Ibrahim, Founder and CEO of RewardLion and a marketing director with over a decade of hands-on experience building sales and marketing analytics strategies for businesses across industries. I've seen how unifying your data — from lead generation through to closed deals — can transform how a business grows.
What is Sales and Marketing Analytics?
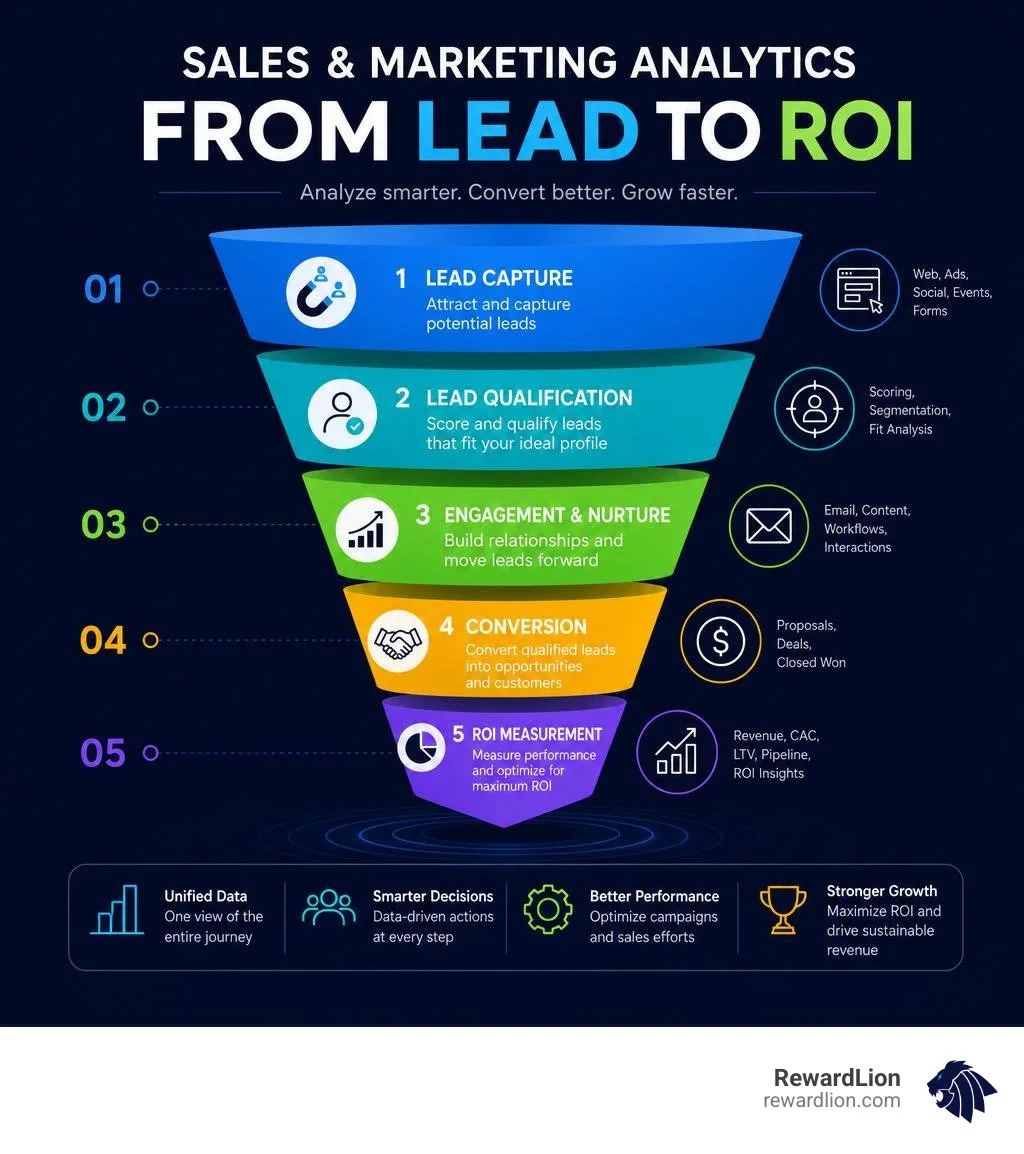
To truly harness the power of your business data, we first need to define what we are looking at. Sales and marketing analytics is the systematic practice of collecting, integrating, and analyzing data from various marketing and sales channels to evaluate performance, understand buyer behavior, and optimize your revenue engine. Instead of looking at marketing campaigns and sales pipelines in isolation, this unified approach analyzes the entire customer journey from the very first touchpoint to the final closed-won deal.
It is common to confuse this practice with customer insights analysis, but they serve different purposes. While customer insights analysis is fundamentally customer-oriented-focusing on customer satisfaction, brand perception, and retention-sales and marketing analytics is process-oriented and heavily focused on operational efficiency and financial return.
To make the distinction clear, let us look at how they compare:
Feature Sales and Marketing Analytics Customer Insights Analysis Primary Focus Processes, conversion rates, pipeline health, and ROI Customer behavior, satisfaction, sentiment, and loyalty Core Objective Optimizing spend, improving conversion rates, and accelerating revenue Improving product-market fit, customer retention, and brand loyalty Data Sources CRM systems, ad platforms, web analytics, and sales pipelines Surveys, focus groups, customer support tickets, and user reviews Key Questions "Which ad channel generated the highest-margin sales?" "Why do customers prefer our product over a competitor's?"
By using a comprehensive framework, we move beyond basic reporting to uncover the exact paths that lead to profitable conversions. This aligns with modern analytics best practices: data-driven decisions eliminate guesswork, reveal what is actually producing revenue, and prove the real value of your campaigns.
Key Metrics and KPIs for Revenue Growth
To run a highly profitable growth engine, we must track the metrics that directly impact our bottom line. Collecting data is easy, but identifying the metrics that actually move the needle is where many teams struggle.
Let us start with the high-level revenue metrics that every leadership team must monitor:
Sales Growth: The percentage increase in revenue over a specific period. It is the ultimate indicator of whether your combined efforts are translating into business expansion.
Customer Acquisition Cost (CAC): The total cost of sales and marketing efforts divided by the number of new customers acquired. Knowing your CAC helps you understand if your customer acquisition model is financially sustainable.
Return on Investment (ROI): This measures the profitability of your campaigns. Generally, a 5:1 revenue-to-ad-spend ratio is considered strong performance, though this varies by industry.
To centralize these metrics and avoid manual calculation errors, teams rely on a dedicated Analytics Platform For Marketing to keep dashboards updated in real time.
Marketing Metrics in Sales and Marketing Analytics
On the marketing side, we need to understand how effectively we are capturing attention and turning it into interest. Tracking these metrics closely is what separates high-growth companies from those that struggle to scale.
Click-Through Rate (CTR): The percentage of people who click on an ad or email link out of the total who view it. A low CTR indicates that your creative or targeting needs adjustment.
Cost Per Lead (CPL): Calculated by dividing your campaign spend by the number of leads generated. If we spend $1,000 on a campaign and generate 300 leads, our CPL is $3.33.
Marketing Qualified Leads (MQLs): Leads that have engaged with our marketing materials and meet our target buyer profile, making them ready for deeper nurturing or a direct sales handoff.
Tracking these metrics dynamically allows us to optimize our budget in real time. For a deeper dive into measuring these early-stage touchpoints, explore our guide on Lead Generation Analytics.
Sales Metrics in Sales and Marketing Analytics
Once marketing hands off a lead, the sales team's metrics take center stage. These metrics tell us how efficiently we are turning interest into actual revenue:
Win Rate: The percentage of total opportunities that result in a closed-won deal. A survey by the RAIN Group identified that the average win rate across B2B industries sits at 47%.
Sales Cycle Length: The average time it takes for a lead to progress from the first contact to a signed contract. Shorter cycles mean faster cash flow and higher sales velocity.
Quota Attainment: The percentage of sales representatives who meet or exceed their assigned sales goals. In most high-performing organizations, maintaining an 80% quota attainment rate is considered a healthy benchmark.
Pipeline Velocity: This calculates how fast revenue is moving through your sales funnel. It factors in the number of active opportunities, average deal size, win rate, and sales cycle length.
To keep these metrics moving in the right direction, we leverage an Ai Driven Sales Platform to automate follow-ups, reduce lead response times, and keep our pipelines moving quickly.
Aligning Teams and Overcoming Implementation Challenges
One of the most persistent bottlenecks in business growth is the division between sales and marketing. A staggering 98% of marketers understand the critical importance of having a centralized, cross-channel view of their performance, yet 71% still evaluate their marketing efforts in isolated silos. When sales and marketing teams operate on separate, disconnected platforms, they end up arguing over data accuracy instead of focusing on growth.

This misalignment leads to major inefficiencies:
Marketing celebrates generating thousands of leads, while sales complains that those leads are completely unqualified.
Sales lets valuable leads go cold, while marketing continues to spend budget on acquiring new ones.
Conversion rates suffer. According to research, conversion rates are eight times greater when a sales representative responds to an inbound lead within the first five minutes. Without real-time data alignment, meeting that five-minute window is nearly impossible.
We can solve these communication and alignment challenges by building a single source of truth. By implementing a unified All In One Analytics system, both teams can look at the same dashboard, agree on lead quality, and coordinate their actions.
A highly effective way to bridge this gap is through automated lead scoring. By assigning point values to leads based on their demographic data and behavioral actions (such as visiting a pricing page or downloading a case study), we ensure that sales only spends time on high-intent prospects. When a lead reaches a specific score, the system automatically routes it to a sales representative for immediate follow-up.
Data Integration and the Power of First-Party Data
To make your sales and marketing analytics truly accurate, you must integrate your online and offline touchpoints. Many businesses make the mistake of only tracking digital clicks, completely ignoring offline events like phone calls, in-person consultations, or direct mail responses. If a customer clicks an ad, browses your website, and then calls your office to close a $10,000 deal, your analytics must connect that offline phone call back to the original digital ad click. Without this cross-channel integration, you might accidentally shut down high-performing ads because they "didn't show digital conversions."
This level of integration is incredibly important in our current environment. Privacy changes have completely transformed the way we collect and use data. In fact, 90% of marketers report that recent privacy updates and the ongoing deprecation of third-party cookies have directly impacted how they measure and evaluate campaign performance.
Because of this shift, relying on third-party tracking pixels is no longer a reliable strategy. Instead, modern businesses must focus on building a robust foundation of first-party data. First-party data is information you collect directly from your audience through direct interactions, such as:
Form submissions and newsletter sign-ups on your website.
Customer purchase histories and customer support chats.
Direct feedback, surveys, and interactive quizzes.
By taking control of your own data collection and integrating it into an Analytics Platform For Marketing, you protect your tracking from browser privacy changes.
For businesses looking to build these advanced tracking systems locally in South Florida, collaborating with a specialized partner can make a significant difference. Working with an experienced local team can help you set up compliant, highly accurate first-party data pipelines that keep your campaigns optimized.
Advanced Analytics: Predictive, Prescriptive, and Forecasting
To stay ahead of the competition, we must move beyond simply looking at past performance. While descriptive analytics tells us what already happened, advanced analytics helps us anticipate what will happen next and outlines the exact steps to take.
Let us look at how these three levels of analytics work together to drive growth:
1. Predictive Analytics: Anticipating Customer Behavior
Predictive analytics uses historical data, machine learning, and statistical algorithms to forecast future outcomes. For example, by analyzing past buying patterns, predictive models can identify which customers are at risk of churning or which leads are most likely to buy this month.
The business value of this is clear: 86% of executives who have used predictive analytics for at least two years report a measurable increase in their ROI. By predicting demand, we can manage our sales resources more effectively and adjust our marketing spend before market shifts happen.
2. Prescriptive Analytics: Taking the Right Action
Prescriptive analytics goes a step further by recommending specific actions based on data. Instead of just showing you a list of high-intent leads, prescriptive systems use AI to suggest the best message, channel, and timing to close each deal.
To make this practical, we use Sales Automation Ai Tools to automate these recommendations. These tools can automatically trigger personalized email follow-ups, adjust ad budgets across channels based on performance, and alert sales reps when a deal is stalling, taking the guesswork out of daily execution.
Best Practices for Audience Segmentation and Personalization
One-size-fits-all marketing is no longer effective. Today's buyers expect experiences that are tailored directly to their needs. In fact, 78% of customers say they are far more likely to make a purchase if a business offers targeted promotions and content that match their specific interests and pain points.

To deliver this level of personalization at scale, we use our integrated sales and marketing data to segment our audience based on three main criteria:
Demographic and Firmographic Data: Segmenting by industry, company size, job title, or location to ensure your messaging is highly relevant to the buyer's professional context.
Behavioral Data: Grouping users based on how they interact with your brand—such as pages visited, content downloaded, email open rates, and products viewed.
Transactional Data: Analyzing past purchase history, average order value, and purchase frequency to identify your highest-value customers.
By segmenting your audience this way, you can design highly personalized campaigns that guide buyers through their specific decision-making process.
For professionals looking to master these modern methodologies, academic programs like the Social Media and E-Marketing Analytics - Seminole State College program offer excellent training in digital tracking and audience analysis.
This growing demand for data expertise is also reflected in the local job market. A quick look at Marketing Analyst jobs in Miami - LinkedIn shows a steady demand for analysts who can turn raw data into personalized campaigns. Similarly, major South Florida employers are actively recruiting top-tier talent for roles like the Sr Manager, Digital Marketing Analytics - AutoNation Careers position, emphasizing just how critical data-driven personalization has become to modern corporate growth.
Real-World Case Studies and Effective Tools
To see how these concepts work in practice, let us look at three real-world examples of businesses using sales and marketing analytics to drive growth:
B2B Technology Firm (Lead Scoring): A enterprise software provider integrated its CRM with marketing behavioral data to implement automated lead scoring. By prioritizing high-intent leads and routing them to sales within minutes, they boosted their sales team's overall operational efficiency by 40%.
E-Commerce Retailer (A/B Testing): An online store used web analytics to run structured A/B tests on their ad creatives and landing pages. By identifying and scaling the highest-converting variations, they reduced their Customer Acquisition Cost (CAC) by 25%.
SaaS Software Company (Budget Optimization): A software provider connected their ad spend directly to mid-funnel pipeline value. They discovered that while display ads generated cheap clicks, search ads generated higher-value customers. Reallocating their budget to these high-performing search channels increased their marketing ROI by 15%.
To get these kinds of results, you need the right tools. But managing multiple disconnected platforms for email, CRM, web tracking, and ad management often leads to data silos and manual reporting errors.
That is why we built the RewardLion OS. Instead of forcing you to piece together separate systems, RewardLion provides a fully unified, AI-powered operating system that connects your marketing, sales, automation, and analytics in one place.
Our unique differentiator is our hybrid model: we don’t just hand you a software platform and leave you to figure it out. Every RewardLion OS deployment is fully implemented, optimized, and managed by your dedicated CAPSS team—acting as your in-house marketing and data agency. To see how we can unify your data and automate your growth, explore our All In One Analytics solutions.
Frequently Asked Questions
How often should we review our performance data?
The ideal review frequency depends on your sales cycle. For fast-moving businesses (like e-commerce or high-volume local services), weekly reviews are essential to catch ad fatigue and optimize daily spend. For businesses with longer B2B sales cycles, monthly deep-dives are more practical for identifying long-term trends and pipeline health, though key conversion metrics should still be monitored weekly.
What is the biggest challenge in implementing these systems?
The primary challenge is almost always data integration. Most businesses run their operations across disparate, disconnected systems—such as separate email tools, CRM platforms, and ad managers. Getting these tools to pass data cleanly to one another to create a single source of truth is highly complex, which is why we recommend using an all-in-one platform that unifies these systems from day one.
Is this data-driven approach only for large enterprises?
Absolutely not. Small and mid-sized businesses actually stand to gain the most from analytics because they have less room to waste budget. By focusing on simple, high-impact metrics like lead conversion rates, cost per lead, and customer acquisition costs, smaller businesses can outmaneuver larger competitors and scale their operations much more efficiently.
Conclusion
Building a successful business requires moving away from gut feelings and transition to data-driven execution. Implementing a complete sales and marketing analytics strategy is the most reliable way to align your teams, optimize your ad spend, and build a predictable engine for growth.
At RewardLion, we make this transition seamless. We install one fully connected growth system that is powered by AI, executed by our team of experts, and optimized continuously to drive revenue for your business.
Ready to stop guessing and start growing? Get Your Quote today, and let us show you how a unified, data-driven operating system can transform your business.