Core Factors Driving Your Google Business Advertising Cost
When planning your paid search campaigns, understanding the mechanics behind your spend is critical. Across all industries, the average Google Ads cost per click is $5.42, while typical monthly budgets range from $1,000 to $10,000 for most small and mid-sized businesses. Google does not charge flat rate subscriptions for ad space. Instead, every single placement is priced in real time via an ad auction. The moment a user types a query into Google, a lightning-fast auction decides which ads appear at the top of the page, where they rank, and exactly what each advertiser will pay if someone clicks.
Several core factors dictate this cost:
Competitor Density and Market Demand: In highly competitive sectors, multiple businesses bid aggressively on the same search terms. This competition pushes up the clearing price for top placements.
Customer Lifetime Value (LTV): High-ticket industries—such as legal counsel, enterprise software, or roofing—can afford to pay significantly more per click because a single acquired client covers months of ad spend.
Keyword Commercial Intent: Keywords that signal immediate purchasing intent (such as "emergency AC repair near me") naturally cost more than broad informational searches (such as "how does air conditioning work").
Targeting and Location: Advertising in competitive metro areas like Miami, Fort Lauderdale, or Boca Raton often commands higher cost per click (CPC) rates than rural regions due to higher advertiser volume.
Account Optimization and Ad Relevance: Google rewards well-structured campaigns that deliver great user experiences by discounting their click costs through Quality Score adjustments.
To see how these forces play out in the market, here is a breakdown of industry benchmarks across average CPC and cost per lead (CPL):
Industry Vertical | Average Search CPC | Average Cost Per Lead (CPL) | Typical Monthly Budget Range |
|---|---|---|---|
Attorneys & Legal Services | $9.87 | $131.63 | $3,000 – $15,000+ |
Home & Home Improvement | $8.33 | $85.50 | $1,500 – $6,000 |
Dentists & Dental Services | $8.00 | $131.63 | $1,500 – $5,000 |
Personal Services | $7.17 | $68.40 | $1,000 – $3,500 |
Health & Fitness | $6.17 | $62.10 | $1,000 – $4,000 |
Real Estate | $5.80 | $102.51 | $2,000 – $8,000 |
Business Services (B2B) | $5.40 | $93.69 | $2,500 – $10,000 |
Furniture & Home Goods | $3.25 | $106.70 | $1,500 – $5,000 |
Apparel, Fashion & Jewelry | $2.75 | $97.51 | $1,000 – $4,500 |
Arts & Entertainment | $1.63 | $27.00 | $800 – $2,500 |
Across the entire ecosystem, the average Google Ads account spends approximately $3,127.38 per month. Data shows that 24% of accounts spend under $1,000 monthly, 39% spend between $1,000 and $10,000 monthly, and 37% spend over $10,000 monthly.
Estimating Average Google Business Advertising Cost by Industry
Your industry vertical is the primary anchor for what you will spend. While the cross-industry average CPC sits at $5.42 and the average cost per lead sits at $66.69, individual industries experience vastly different pricing environments.
In the legal vertical, attorneys face an average CPC of $9.87, with high-intent personal injury terms frequently rising to $50 or more per click. The trade-off is substantial: a single case settlement can generate tens of thousands of dollars, easily justifying a $131.63 average cost per lead.
Conversely, home improvement contractors navigate an average CPC of $8.33. Service providers like plumbers, roofers, and HVAC technicians rely on rapid customer conversion, making call tracking and localized visibility essential. Dental practices see average CPCs hovering around $8.00, with lead costs averaging $131.63 as practices compete for recurring patient relationships.
For B2B business services and real estate, lead acquisition costs average $93.69 and $102.51 respectively. In these spaces, lead nurturing and fast follow-up play an equal role alongside front-end bidding in determining true profitability.
How Quality Score Directly Lowers Your Google Business Advertising Cost
Many advertisers assume the highest bidder always wins the top ad position. In Google Ads, that is not how the auction operates. Google determines ad rank using a combination of your maximum bid and your Quality Score (a 1 to 10 diagnostic rating of ad quality).
The core formula Google uses to determine Ad Rank and actual CPC works like this:
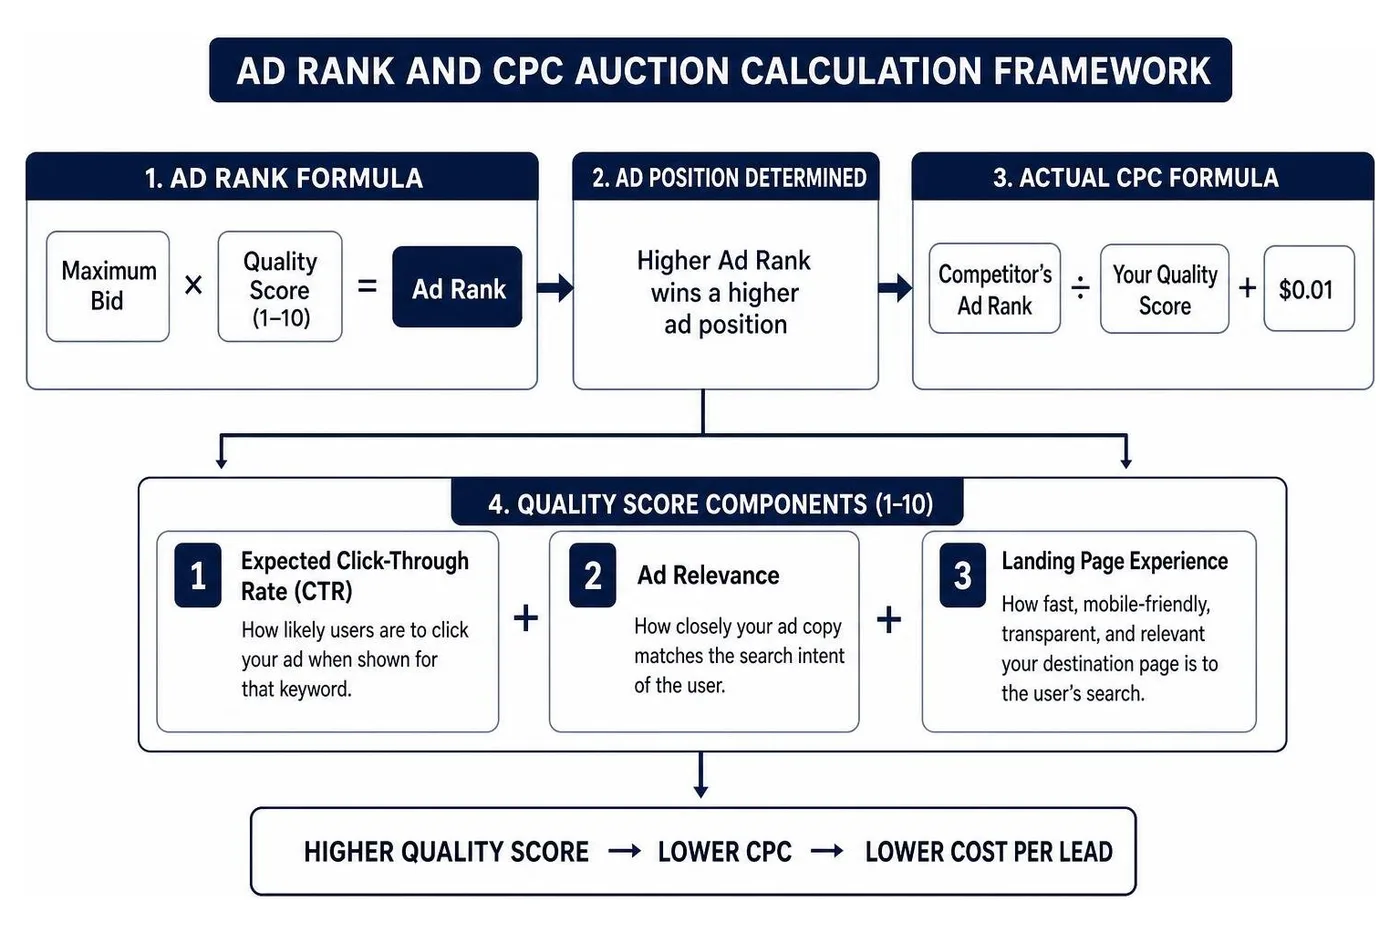
Quality Score evaluates three distinct factors:
Expected Click-Through Rate (CTR): How likely users are to click your ad when shown for that keyword.
Ad Relevance: How closely your ad copy matches the search intent of the user.
Landing Page Experience: How fast, mobile-friendly, transparent, and relevant your destination page is to the user’s search.
Improving your Quality Score delivers a massive pricing advantage. Improving Quality Score by just 1 point can reduce your cost per click by 15% to 20%. Conversely, low Quality Scores act as a penalty, forcing you to bid significantly more than competitors just to maintain the same ad position.
Keyword Intent and the Ad Auction Mechanics
Not all keywords yield equal revenue. Understanding search intent prevents your budget from burning through low-converting traffic.
Informational Queries: ("how to unclog a bathroom drain") — Low commercial intent, low CPC, but very low immediate sales conversion.
Commercial Investigation: ("best plumbing services in Fort Lauderdale") — Medium-to-high intent; users are evaluating their options.
Transactional Queries: ("emergency plumber near me open now") — Highest intent, highest CPC, but highest conversion rates.
To capture high-intent local demand without overspending, service businesses frequently pair traditional search ads with a verified Local Service Ads setup. This format operates on a pay-per-lead model rather than pay-per-click, offering direct phone calls backed by the Google Screened or Google Guaranteed badge.
To control your costs inside the standard auction, always establish maximum CPC bid limits, set precise geotargeting around your service areas, and use dayparting (ad scheduling) to show ads only during operating hours when your team can promptly answer calls and incoming inquiries.
How to Calculate and Pave a Realistic Monthly Ad Budget
One of the most common pitfalls for small business owners is launching campaigns with an arbitrary budget and hoping for immediate profitability. Structuring a sustainable paid acquisition channel requires working backward from unit economics.
To build predictable revenue, businesses often integrate their ad accounts with automated lead generation systems that capture, route, and follow up with inbound inquiries instantly.
For businesses testing Google Ads for the first time, a practical starting budget is $1,000 to $2,000 per month (or roughly $20 to $50 per day). This provides enough data volume to evaluate search queries, measure actual conversion rates, and optimize bids without overextending capital. Established 7-figure service businesses commonly run between $3,000 and $15,000 monthly across their Google channels.
Understanding the 30.4-Day Rule and Daily Spending Limits
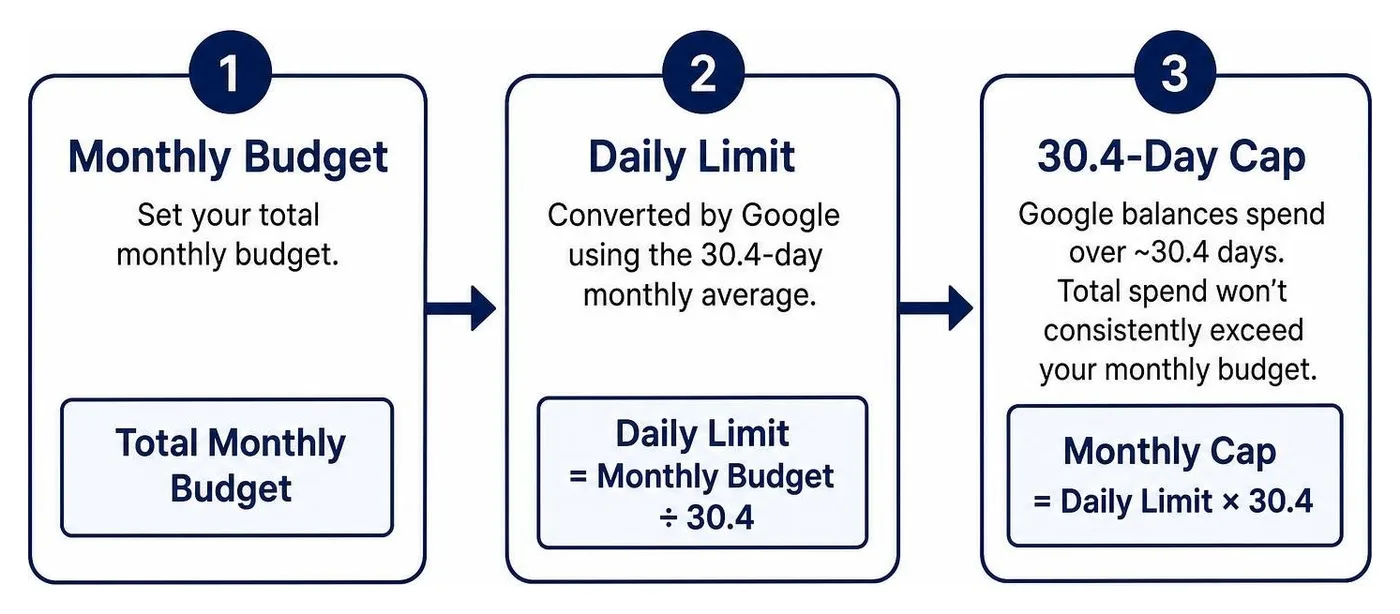
When you enter a daily budget into Google Ads, Google does not treat that number as an unyielding daily cap. Instead, it balances your spend over an entire billing cycle using its 30.4-day rule (the average number of days in a month: 365 ÷ 12).
Here is how Google manages daily vs. monthly spend:
Daily Spending Limit: On days with high search volume or high conversion probability, Google may spend up to 2 times your average daily budget.
Monthly Spending Limit: Google will never charge you more than 30.4 times your average daily budget in a single calendar month.
For instance, if you set a $1,000 monthly budget, you will enter an average daily budget of $32.89 ($1,000 ÷ 30.4). On a busy Monday, Google might spend $60.00. On a slow Sunday, it might spend $12.00. Over the complete month, your total charges will cap at $1,000. You can monitor and simulate these pacing curves directly using the Google Ads campaign budget tool.
Calculating Break-Even ROAS and Target CPL
To ensure your campaigns generate a positive financial return, calculate your Break-Even Return on Ad Spend (ROAS) before launching. Break-even ROAS represents the exact revenue multiple required to cover both your ad spend and the direct cost of fulfilling the product or service.
The formula for break-even ROAS is:
$$\text{Break-Even ROAS} = \frac{1}{\text{Contribution Margin}}$$
For example, if your business operates at a 40% profit margin after fulfillment costs, your calculation is:
$$\frac{1}{0.40} = 2.5\times \text{ ROAS}$$
This means you must generate at least $2.50 in revenue for every $1.00 spent on advertising to break even. Any return above 2.5× represents net profit.
Consider this practical unit-economics model:
Monthly Ad Spend: $1,000
Average CPC: $1.25
Total Clicks Generated: 800 clicks ($1,000 ÷ $1.25)
Landing Page Conversion Rate: 3%
Total Orders / Leads: 24 ($800 \times 0.03$)
Cost Per Acquisition (CPA): $41.67 ($1,000 ÷ 24)
Average Order Value: $75.00
Total Revenue: $1,800 ($75 \times 24)
Resulting ROAS: 1.8×
If your target ROAS is 2.5×, generating 1.8× means you must either raise your conversion rate from 3% to 4.2%, negotiate lower CPCs, or implement follow-up marketing automation to lift customer lifetime value through repeat purchases and automated up-sells.
Maximizing Performance Across Google Campaign Types
Google Ads provides several distinct campaign networks. Each network serves a specific stage in the customer journey and carries different cost structures and conversion dynamics.

Connecting search intent with broader audience touchpoints through unified omnichannel marketing ensures you engage prospects across the entire web rather than relying solely on high-cost bottom-of-funnel search terms.
Search vs. Shopping, Display, and Video Costs
Here is how Google's ad channels compare across pricing and primary use cases:
Google Search Network:
Cost Range: $1.00 to $50.00+ CPC depending on vertical competition.
Intent Level: High. Users are actively typing what they want.
Best For: Direct lead generation, local emergency services, and urgent product purchases.
Google Shopping & Performance Max:
Cost Range: $0.50 to $5.00 CPC.
Intent Level: High visual and commercial intent.
Best For: E-commerce stores showcasing product images, prices, and merchant reviews directly in search results.
Google Display Network (GDN):
Cost Range: $0.25 to $1.50 CPC (or $2.00–$5.00 CPM).
Intent Level: Low-to-medium passive browsing.
Best For: Retargeting past website visitors, brand visibility, and keeping your company top-of-mind across 3+ million partner websites and apps.
YouTube Ads:
Cost Range: $0.05 to $0.30 per view (CPV), or $10 to $30 CPM.
Intent Level: Medium. Video engagement builds deep authority.
Best For: Video storytelling, product demonstrations, and brand authority campaigns.
Eliminating Wasted Spend with Negative Keywords
The single biggest drain on Google Ads profitability is search query bleed. The average unmanaged Google Ads account burns $1,127.54 every month on irrelevant clicks.
When you bid on broad match or phrase match keywords, Google displays your ads for related variations. Without strict guardrails, an HVAC company bidding on "AC installation" might pay for clicks on queries like:
"free AC repair manual PDF"
"how to fix AC unit by myself"
"AC technician salary in Miami"
"cheap used air conditioners on Craigslist"
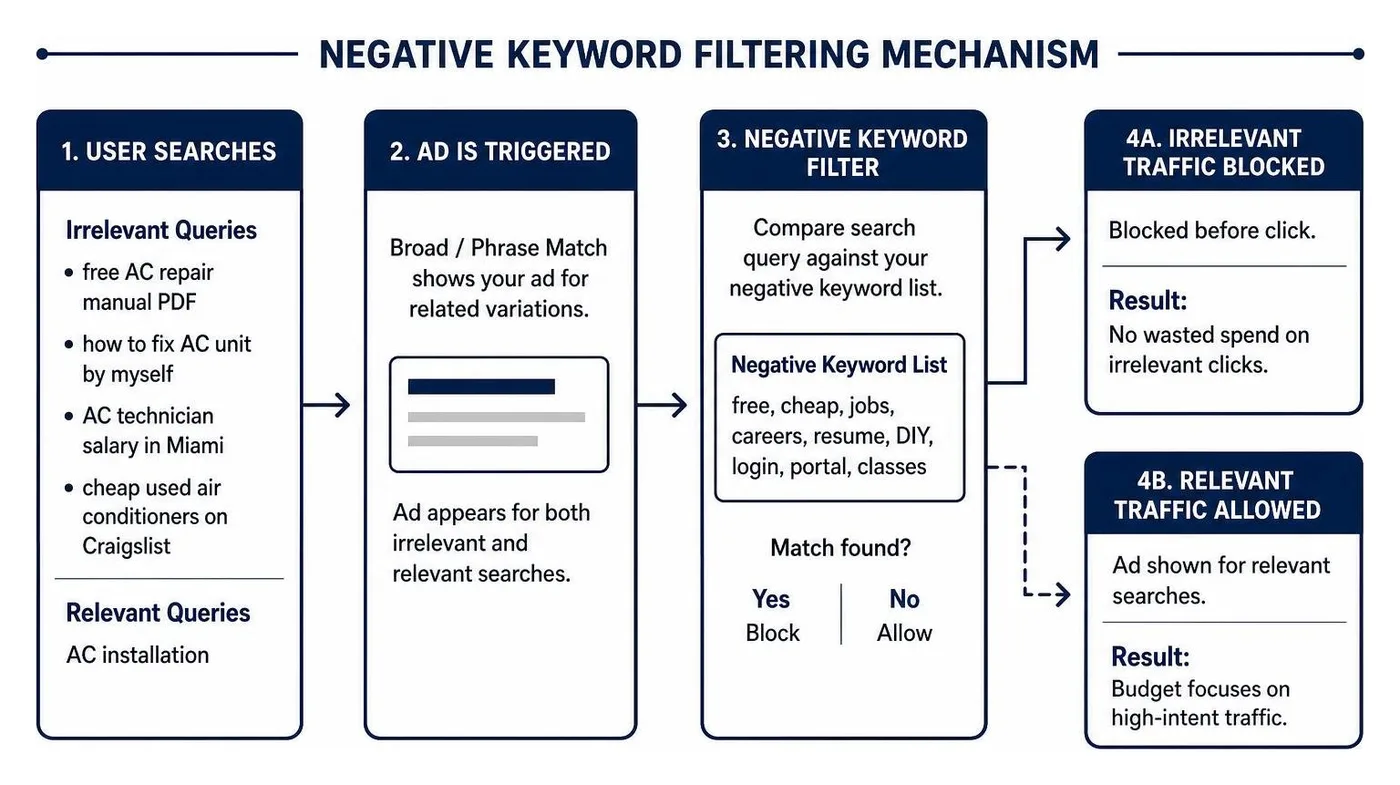
To prevent this waste:
Audit the Search Terms Report Weekly: Identify non-converting queries that triggered your ads and immediately add them to your negative keyword list.
Build Account-Level Negative Lists: Include universal negative terms such as free, cheap, jobs, careers, resume, DIY, login, portal, and classes.
Use Exact and Phrase Match Strategically: Avoid setting high budgets on pure broad-match keywords until your conversion tracking and Smart Bidding algorithms have gathered at least 30 to 50 conversion events per month.
Frequently Asked Questions About Google Ads Pricing
What is the minimum monthly budget needed to test Google Ads?
A realistic testing budget is $1,000 to $2,000 per month for a minimum of 60 to 90 days. While you can technically launch campaigns for $10 to $20 per day, allocating under $1,000 per month significantly slows down data collection in competitive niches.
If your industry average CPC is $5.00, a $300 monthly budget yields only 60 clicks over 30 days. At a typical 3% to 5% conversion rate, 60 clicks produce just 1 to 3 leads across an entire month. That sample size is too small to determine whether keyword selection, ad copy, or landing pages need optimization. A $1,000 to $2,000 monthly budget provides the statistical volume needed to make confident, data-backed campaign decisions.
Why did Google spend more than my daily budget setting?
Google utilizes flexible daily pacing. On days when search traffic spikes or the algorithm identifies users who are highly likely to convert, Google may spend up to 2 times your average daily budget.
This is not an overcharge. Google balances peak traffic days against lower-volume days so that your total billing over a full monthly billing cycle will never exceed 30.4 times your average daily budget. If you set a daily budget of $50, Google might spend $90 on a high-intent Tuesday and $25 on a quiet Sunday, maintaining your $1,520 monthly cap ($50 × 30.4).
How much does cost per click vary across industries?
Cost per click varies dramatically based on client lifetime value and auction competition. Across all US industries, the average Search CPC sits at $5.42, but vertical pricing spans a wide spectrum:
Arts, entertainment, and e-commerce frequently see clicks between $1.00 and $3.00.
B2B services, healthcare, and dental practices average $5.00 to $8.50.
High-ticket professional services like legal counsel and commercial contracting frequently range from $10.00 to over $50.00 per click.
Conclusion
Managing your paid search costs successfully is not about finding the lowest possible cost per click. It comes down to building a finely tuned acquisition engine where customer value exceeds total acquisition cost. By maintaining high Quality Scores, establishing disciplined daily budget pacing, actively filtering irrelevant traffic with negative keyword lists, and tracking revenue instead of vanity metrics, your ad spend becomes a predictable revenue generator rather than an operational expense.
At RewardLion, we eliminate the guesswork of digital advertising. Our all-in-one AI-powered operating system combines full-funnel tracking, automated lead nurture workflows, and dedicated marketing management to maximize every dollar you deploy. Explore our dedicated paid advertising services to turn your Google ad budget into predictable, profitable revenue growth.